
Enterprises can no longer rely on gut-feeling decisions or static reports. Leaders need to see how their business is performing in real time: where services are slowing down, which teams are under pressure, and where automation can move the organization ahead.
As of 2025, nearly 65% of organizations are already adopting or actively evaluating AI technologies for data and analytics. This is where ServiceNow Performance Analytics makes an impact. It gives teams a customizable, time-based view of trends, targets, and performance gaps, turning operational data into a single, trusted source of truth that accelerates decision-making and delivers rapid time-to-value.
What Is ServiceNow Performance Analytics?
Performance Analytics in ServiceNow is an in-platform optimization solution that uses KPIs and real-time snapshots of data to track, analyze, and improve how services and processes perform over time. It turns operational data into trends, forecasts, and role-based dashboards so enterprises can make proactive and data-driven decisions, all while your data stays secure and scales automatically.
Example: If your Incident backlog spikes every Monday, traditional reporting will tell you after it happens. ServiceNow Performance Analytics highlights the trend, shows where the backlog originates, and predicts when it may breach SLAs, giving teams a chance to rebalance workloads before service quality dips.
Who it’s for:
- ServiceNow Program Owners who need to improve platform ROI, improve decision-making, and demonstrate value to leadership.
- CIOs & IT leaders who want proactive service management and business-aligned operations.
- Front-line employees & Process Owners who need real-time, in-context information to fulfill requests faster and prevent service breaches.
What’s New?
Until recently, Performance Analytics scores were only calculated in scheduled batches, so teams often looked at yesterday’s picture instead of today’s.
With the Australia release, ServiceNow introduced a new class of indicators called Data Snapshots, which track changes minute by minute, including during shifts that are still in progress. Scores accumulate and display live throughout the day, giving leaders a genuinely real-time view instead of a next-morning report.
This also removes the old two-level breakdown limit, so indicators can be sliced by far more dimensions than before.
ServiceNow Performance Analytics vs Reporting vs Process Mining
Before we compare the three, it’s important to understand that Performance Analytics, Reporting, and Process Mining are all part of ServiceNow’s broader Platform Analytics ecosystem.
Capability | Performance Analytics | Reporting | Process Mining |
Purpose | Track and trend KPIs for proactive, continuous improvement. | Provide real-time snapshots to show what’s happening now. | Reconstruct actual process flows to expose inefficiencies. |
Users | CIOs, Process Owners, Service Owners. | Analysts, managers, business users. | Transformation teams, Process Excellence, Automation leads. |
Core Features | KPIs, KPI Details, Spotlight, breakdowns, forecasts. | Dashboards, Report Designer, NLQ. | AI-generated maps, Task Mining, root cause analysis. |
Time Lens | “How are we performing over time?” | “What’s happening right now?” | “How do our processes actually run?” |
Example | Spot a weekly spike in P2 incidents and reassign capacity early. | Check today’s open incidents by priority. | Identify rework loops causing delays. |
Each capability plays a different role, but together they give enterprises a complete analytics stack: from real-time operational visibility (Reporting), to KPI-driven improvement (Performance Analytics), to deep process intelligence and automation discovery (Process Mining).
Performance Analytics vs. Platform Analytics: What Changed in 2026
Platform Analytics is a bigger umbrella that Performance Analytics sits inside. Think of it as a single home for all of ServiceNow’s analytics tools. Performance Analytics is one of the data sources feeding into it, alongside Reporting and other analytics capabilities.
For anyone already using Performance Analytics, nothing breaks: your existing indicators, KPIs, and scores continue to work exactly as before. What’s changing is where you go to build and view new content:
- New indicators are increasingly built as Data Snapshots rather than the older method.
- You explore KPI data through KPI Details instead of Analytics Hub.
- Dashboards are increasingly viewed through Platform Analytics instead of classic Core UI dashboards.
There’s no deadline forcing you to migrate existing dashboards or KPIs. But if you’re planning new analytics work, it’s worth building it with Platform Analytics in mind, since that’s the direction ServiceNow is heading
Why ServiceNow Performance Analytics Is a Must-Have?
Performance Analytics elevates ServiceNow from a transactional platform into a strategic decision engine. It gives leaders the visibility, foresight, and operational intelligence needed to run more efficient, resilient, and business-aligned services. Below are the core benefits that make Performance Analytics a critical asset for enterprises looking to mature their digital operations:
1. Anticipate Trends & Maximize Automation
With ServiceNow Performance Analytics, you can monitor trends to identify areas for improvement and detect service slowdowns before they occur. It also highlights where automation, AI, or self-service can eliminate manual work, reduce operational costs, and deliver faster, consistent experiences.
2. Prioritize Resources
By surfacing what needs immediate attention, such as SLA risks, workload imbalances, or service disruptions, Performance Analytics helps leaders deploy resources strategically. Teams can quickly shift coverage, rebalance queues, and address high-impact issues before they escalate.
3. Drive Continual Service Improvement
Using KPIs, Analytics Hub, forecasts, trend lines, and contextual dashboards, teams get a clear view of what’s performing well and what’s not. This enables a continuous improvement cycle where data backs every decision. Leaders can identify root causes, benchmark progress, and systematically enhance service quality over time.
4. Quick Insights
Performance Analytics delivers personalized, real-time insights without the need for manual reporting. With a single click, users get updated views of their KPIs, automated reports, and contextual intelligence, empowering faster decisions at every level of the organization.
5. Establish a Single Version of Truth
By standardizing KPIs, visualizations, and data definitions, Performance Analytics creates one authoritative view of performance across teams. This consistency reduces confusion, builds trust in the data, eliminates scattered information sources, and ensures every stakeholder is making decisions based on the same reliable information.
6. Accelerate Time-to-Value
Performance Analytics can be implemented in weeks, allowing organizations to start taking advantage of trends, forecasts, and insights quickly. This rapid time-to-value means teams begin improving service performance, efficiency, and decision-making almost immediately.
Capabilities of ServiceNow Performance Analytics (with examples)
ServiceNow Performance Analytics comes with powerful features designed to improve quality of business services and processes. These features work together to give enterprises clarity across their processes and performance trends.
1. Intelligent Prioritization with Spotlight
Spotlight helps teams focus on what truly needs attention by ranking tasks or records based on defined business requirements. Instead of manually sorting through work queues, teams instantly see which issues pose the highest impact to operations or customer experience. This ensures that resources are allocated where they drive maximum value.
Example: A Service Desk team may receive hundreds of incidents each morning. Spotlight automatically ranks them based on impact, urgency, and SLA risk, highlighting which ones need immediate attention.
2. KPIs & Dashboards
With 600+ pre-built KPIs, teams get immediate visibility into operational and business performance. It’s worth noting that as ServiceNow shifts dashboard creation toward the unified Platform Analytics experience, Performance Analytics widgets and classic Core UI dashboards are now considered legacy. Existing ones continue to function, but new dashboard-building happens in Platform Analytics going forward.
Improve Your KPIs with ServiceNow Performance Analytics
3. Flexible Data Integration
Performance Analytics supports blending native ServiceNow data with external sources such as Excel files or JDBC data connections. This allows you to expand your analysis beyond the platform while maintaining compatibility with existing configurations and customizations. KPIs and dashboards seamlessly integrate this combined data, giving teams a unified, accurate view of performance across systems.
Example: A Change Manager can blend ServiceNow change success rates with deployment metrics pulled from an external DevOps tool. This unified view reveals, for example, that failed deployments spike after certain release windows.
4. Powerful Native Analytics
ServiceNow Performance Analytics provides deep visibility into trends, patterns, and thresholds using native, real-time analytics. Automated alerts surface when KPI values reach highs, lows, or predefined limits, helping teams act before issues escalate. Built-in text analytics extract meaningful insights from unstructured fields such as comments or descriptions. Workbenches offer a clear, end-to-end view of processes, helping teams diagnose root causes and track improvements across timelines.
Example: Text analytics may detect recurring phrases in incident comments, like “VPN disconnecting” or “slow login”, revealing a trend before it becomes a major outage.
5. Analytics For Everyone
Front-line teams get access to live trend information to accelerate fulfillment and deliver consistent service. In-form analytics provides context-sensitive insights directly where work is performed, whether resolving incidents, approving changes, or managing requests. This helps employees identify early warning signs, prevent service breaches, and escalate issues when necessary, all without leaving their workspace.
Example: While resolving an incident, an agent can view an in-form trend chart showing how often similar requests spike on Mondays. If it looks like a recurring issue, they can immediately flag it for a problem investigation.
6. KPI Details
KPI Details (formerly Analytics Hub) is where teams explore performance data in depth. Filtering by breakdown, calendar period, or time range, setting up alert subscriptions when a KPI crosses a target or threshold, viewing hierarchical roll-ups across teams or regions, and customizing how scores are displayed. As of the Australia release, ServiceNow has consolidated Analytics Hub into KPI Details, so this is now the single place to dig into any indicator’s performance over time.
ServiceNow has also made data mining more resilient in this release. Scores can now be collected regardless of table record volume gaps are automatically flagged when data mining is disabled, and activation failures now point to the exact scripted breakdown causing the issue instead of a generic error message. For enterprises running PA at scale, this reduces the troubleshooting overhead that used to fall on admins.
ServiceNow Performance Analytics Dashboard Example
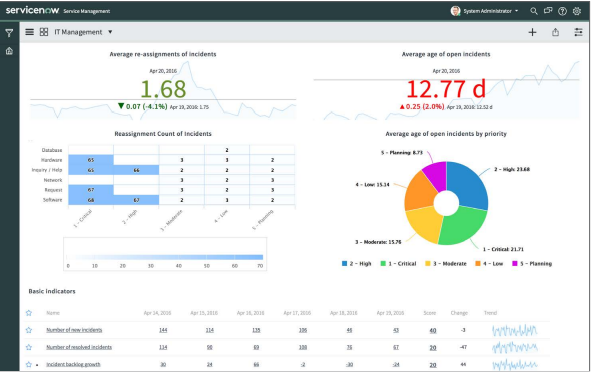
This dashboard gives a clear view of how incidents are moving through the system. The left side tracks average re-assignments of incidents and shows which categories (like Hardware or Software) see the most handoffs, helping teams pinpoint workflow friction.
The right side highlights the average age of open incidents and breaks it down by priority, making delays and ageing risks easy to spot. At the bottom, core indicators (new, resolved, and backlog growth) summarize daily workload and performance.
How to Roll Out Performance Analytics in Your Enterprise?
Performance Analytics is part of the ServiceNow AI platform and is fully compatible with the applications already running in your ServiceNow environment.
Get Started with ServiceNow Performance Analytics
How To Create a Report in ServiceNow Performance Analytics
To help you get hands-on with Performance Analytics, here’s a clear walkthrough of how to create a report from scratch. The process is fast, mostly under 2 minutes and gives you immediate visibility into the data leaders use to achieve organizational goals.
Step 1: Create a New Report
Once you’re in the Performance Analytics dashboard, look for the option to create a new report. This is typically found in the filters section, where you can search for “report” and select “Create New”.
Step 2: Set Up Name & Source Data Table
Next, the data tab is where you’ll establish the foundation of your report. In the left column, you’ll find the “Report Name” field. Give your report a clear, descriptive name that reflects the metric or insight you’re tracking. In the “table” or indicator field, choose the specific data you want to analyze.
Step 3: Data Visualization Formatting
The Type tab allows you to select how your data will be displayed. ServiceNow Performance Analytics offers several visualization options (Score, Bar Chart, Pie Chart, Line Chart, Table) to suit different data and analysis needs. Choose the one that best communicates your data’s story to your audience.
Step 4: Report Configuration & Data Filters
Now, the Configure tab is where you refine exactly what appears in your report. In the center of your screen, you’ll see options to add filters. Click to add a new filter and specify the conditions for the data you want to display. For example, you might filter by priority levels, assignment groups, data ranges, status, categories or subcategories. You can add multiple filters to create highly specific reports that answer precise business questions.
(Use the “AND” and “OR” operators to build complex filter logic when needed.)
Step 5 (Optional): Styling & Visual Preferences
Next, the Style tab enables you to fine-tune the appearance of your report. You can customize colors, adjust labels, legends, and use formatting options to make your report more understandable.
Step 6: Save the Report
Click the Save button, and your report will be created. From here, you can add your report to existing dashboards or create new dashboards to organize related metrics together.
ServiceNow Performance Analytics in Your Context
At the core, we have explored how ServiceNow Performance Analytics turns scattered operational data into forward-looking insights, giving enterprises the ability to predict issues, track KPIs that matter, and drive continuous improvement with confidence.
At Aelum, we help enterprises put this into action. From defining the right KPIs to preparing clean data, designing dashboards, and integrating Performance Analytics with your existing workflows, we ensure the solution is implemented the right way for your business based on your use cases. If you’re ready to bring predictive, data-driven decision-making into your operations, our experts can guide you 1:1.